CRO is a very versatile instrument in laboratory for measurement of voltage, current, frequency and phase angle of any electrical quantity. But before we go ahead with discussion on measurement of electrical quantities with CRO, we should understand some basic oscilloscope patterns.
Basic Oscilloscope Patterns

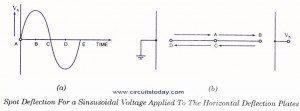
Assume that a sinusoidal voltage signal is applied to the horizontal deflection plates without applying any voltage signal to the vertical deflection plates, as shown in figure.
At point A in time, the voltage is zero so the spot remains undeflected at centre point of the screen. At point B in time, voltage Vh is maximum positive so the spot is at the extreme right end on the screen. At point C in time, once again the voltage is zero so the spot comes back to the central position on the screen. At point D in time, the voltage is maximum negative and so the spot is at the extreme left end on the screen. At point E in time, the voltage is zero so the spot returns to the central position of the screen. This way for next voltage cycle the spot again moves from point A to point B on the screen. So we get a horizontal line on the screen. One thing is to be kept in mind that this horizontal line is in the central position vertically as no voltage has been applied to vertical defection plates.
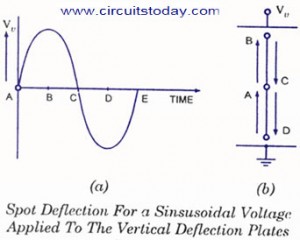
If sinusoidal voltage signal is applied to the vertical deflection plates without applying any voltage signal to horizontal deflection plates then we get a vertical line on the screen of CRO, as shown in figure. This line would be in the central position on the screen horizontally.
By this time we have seen what type of pattern we get when sinusoidal voltage signal is applied to horizontal or vertical deflection plates alone. Now we would discuss what happens when both horizontal and vertical defection plates are supplied with sinusoidal voltage signals simultaneously.
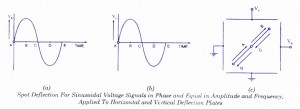
Let us consider a case, when two sinusoidal voltage signals equal in magnitude and frequency and in phase are applied to both of the horizontal and vertical deflection plates, as shown in figure.
At point A in time, voltages at both of the plates are zero so the spot is in the centre of the screen. At point B in time, voltages applied to both of the plates are maximum positive, so the spot appears at the extreme right end in horizontal direction and extreme upward in the vertical direction. At point C in time, again both voltages are zero so the spot moves back to centre of the screen. At point D in time, voltages applied to both of the plates are maximum negative, so the spot appears at the extreme left end in the horizontal direction and extreme downward in the vertical direction. As both of the voltage signals are in phase and equal in amplitude and frequency, so at any time voltage signals applied to horizontal and vertical deflection plates are equal in magnitude as well as in sign. That is why, at any instant movement of the spot is same in horizontal (X-axis) as well as in vertical (Y-axis) directions. Thus a straight line inclined at 45° to the positive X-axis is obtained on the screen, as shown in figure.
Here it is very important to note that at any time the movement of the spot on the screen is the vector sum of the horizontal and vertical deflections and the horizontal and vertical deflections are proportional to the voltages applied to the horizontal and vertical deflection plates respectively. So if sinusoidal voltage signals, in phase, and equal in amplitude and frequency are applied to horizontal and vertical deflection plates we get a straight line inclined at 45° to the positive X-axis, as explained before. If amplitude of sinusoidal voltage signal applied to the vertical deflection plates is less than that of the voltage signal applied to horizontal deflection plates, then the deflection
of the spot along Y-axis would be less than that along X-axis direction. So we get a straight line inclined at an angle, less than 45° to the positive X-axis. When voltage applied to the vertical deflection plates is more than that applied to the horizontal deflection plates, we will get a straight line inclined at an angle, more than 45° to positive X-axis.
Now let us consider a case when two sinusoidal voltage signals applied to the horizontal and vertical deflection plates are of equal magnitude but opposite in phase, as shown in figure.
At point A in time, both voltage signals are zero so the spot is at the central position of the screen. At point B in time, voltage applied to horizontal deflection plates is maximum negative while the voltage applied to the vertical deflection plates is maximum positive, so the spot moves a maximum distance to the left and upward, as shown in figure. Similarly at point C in time the spot comes back to the central position of the screen and at point D in time, it goes to maximum right and downward, as shown in the fig. Thus we get a straight line inclined at 135° to the positive X-axis, as shown in figure.
In third case, if the two sinusoidal voltage signals, 90° out of phase and of equal amplitude and equal frequency, are applied to the horizontal and vertical deflection plates, a circle would appear on the screen, a shown in figure. At point A in time, voltage applied to the horizontal deflection plates is maximum positive and the voltage applied to the vertical deflection plates is zero, so the spot moves extreme right end on the X-axis without any movement along the Y-axis. At point B in time, the voltage applied to horizontal deflection plates is zero but the voltage applied to the vertical deflection plates is maximum positive, so the spot moves maximum in upward direction without any horizontal movement. Similarly the spot moves, for points C and D in time, on the screen, as shown in figure. Thus during one cycle of sine wave, the spot traces out a circle on the screen.
Buyers Guide – We have published a useful buyer’s guide comparing the best analog oscilloscopes available in the market at present. The guide reviews features of different oscilloscopes and compares the merits of differennt models against the other.
MEASUREMENT OF PHASE DIFFERENCE
We have discussed that when two sinusoidal voltage signals of equal frequency having some phase difference are applied to the deflection plates of CRO, a straight line or an ellipse appears on the screen. In the case of straight line appearing on the screen, phase angle difference would be zero or 180° but in case of an ellipse we will have to use a formula for determination of phase difference.
Let there be two sinusoidal voltage signals given by
vh = Vh Sin ωt
vv = Vv Sin (ωt+Ф), where Ф is the phase difference.
Since deflection is directly proportional to the amplitude of voltage
So dh = Dh Sin ωt
dv = Dv Sin (ωt+Ф)
At time t=0, values of dh and dv are dh0 = 0 and dv0 = Dv Sin Ф
So Sin Ф = dv0/Dv
Graphical meaning of dv0 and Dv are shown in the figure. Thus the phase difference between two sinusoidal voltages of equal frequency can be determined by measuring dv0 and Dv.
In the given figure Vv is shown by leading Vh by a phase angle Ф. If the situation is reversed and Vh leads Vv by phase angle Ф, then again same ellipse would appear on the screen. Because of this fact we can determine only the phase angle between two sinusoidal voltages. It does not indicate which one is leading and which one is lagging.
MEASUREMENT OF FREQUENCY OF A VOLTAGE SIGNAL
The patterns obtained on CRO screen and discussed in previous sections are called the Lissajous patterns. A Lissajous pattern is a pattern which is stationary on the screen of a CRO. It means that the spot traces out the same pattern for every cycle of a voltage signal. As we have already studied that the ratio of frequencies of vertical and horizontal voltage signals should be a rational or fractional number to have steady pattern. So the condition for having a Lissajous pattern on the CRO screen is
Fy / Fx = A/B
where A and B are integers.
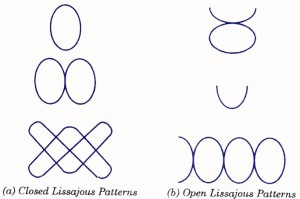
Lissajous patterns are usually of two types. First one is closed Lissajous pattern and has no free end. Second one is open Lissajous pattern and has free ends. Both types of Lissajous patterns are shown in figure.
In a Lissajous pattern ratio of frequency of vertical signal to the frequency of horizontal signal is equal to the ratio of positive Y-peaks to positive X-peaks in that pattern.
Fy / Fx = Positive Y – peaks in pattern / Positive X – peaks in pattern
Thus by counting the positive Y-peaks and X-peaks on a Lissajous pattern, ratio of frequencies of two voltage signals can be determined. In case of an open lissajous pattern, free end is treated as half peak. This will be clear from examples.
Voltage signal of unknown frequency is applied to the vertical deflection plates and horizontal deflection plates are supplied by an accurately calibrated variable frequency source. Frequency of the variable frequency source is adjusted until a stationary pattern appears on the screen. Now by reading the value of frequency of horizontal signal, with the help of calibrated scale, frequency of voltage signal applied to vertical deflection plates can be known.

In case single loop stationary pattern is obtained the frequency of the sinusoidal voltage applied to vertical deflection pates is the same as that of the voltage applied to horizontal deflection plates. In case complex Lissajous figure is obtained, the frequency of alternating voltage may be determined using the relation
Points of tangency to a vertical line / Points of tangency to a horizontal line = ωx/ωy = fx/fy
One point, very interesting, to know is that sometimes we may have different types of patterns on the CRO screen for the voltage signals of the given frequencies, as shown in figure.
In both of the figures, the ratio of Y-peaks to X-peaks is equal so in both cases, ratios of frequencies of vertical and horizontal signals are same. But appearance of Lissajous patterns is different owing to different phase difference of voltage signals applied to vertical arid horizontal deflection plates.
CRO is not a precision instrument for measuring frequency of an alternating voltage because the accuracy depends directly on the accuracy of calibrated scale of variable frequency source, which is usually a few percent. It is used for rough estimate of frequency or when voltage waveform is so complex that a frequency counter would not operate reliably.
Measurement of Voltage and Current
Cathode Ray Oscilloscope can be used for the measurement of voltage of any electrical specification as the deflection of the electrostatic beam is directly proportional to the deflection plate voltage.
For measurement of the direct voltage, firstly the spot is centered on the screen without applying any voltage signal to the deflection plates. Then direct voltage to be measured is applied between a pair of deflection plates and the deflection of the spot is observed on the screen. The magnitude of the deflection multiplied by the deflection factor gives the value of the direct voltage applied. Usually the screen is calibrated for fixed operating condition, so by reading the scale, voltage can be measured directly by the CRO.
In case of measurement of alternating voltage of sinusoidal wave-form, it is applied between a pair of deflection plates and the length of the straight line is measured. Knowing the deflection sensitivity, the peak to peak value of applied ac voltage can be determined. The rms value of ac voltage applied will be equal to this peak value divided by 2√2 for sinusoidal wave-form.
For measurement of current, the current under measurement is passed through a known non-inductive resistance and the voltage drop across it is measured by CRO, as mentioned above. The current can be determined simply by dividing the voltage drop measured by the value of non-inductive resistance. When the current to be measured is of very small magnitude, the voltage drop across non-inductive resistance (small value) is usually amplified by a calibrated amplifier.
The current and voltage can be measured simultaneously by using double beam cathode ray oscilloscope.


3 Comments
Which quantities can be measured using oscilloscope?
Hi Mhesh Tektronix has got range of clip on HF current probes. You can contact their Bangalore office for your requirement.
http://www.tek.com/
Tektronix (India) Private Limited
+91 80 3079 2600
Dear sir
How to obtain high frequency current signal on CRO. we are using Tektronix CRO in our lab…please suggest